Evolutionary Coupling Analysis
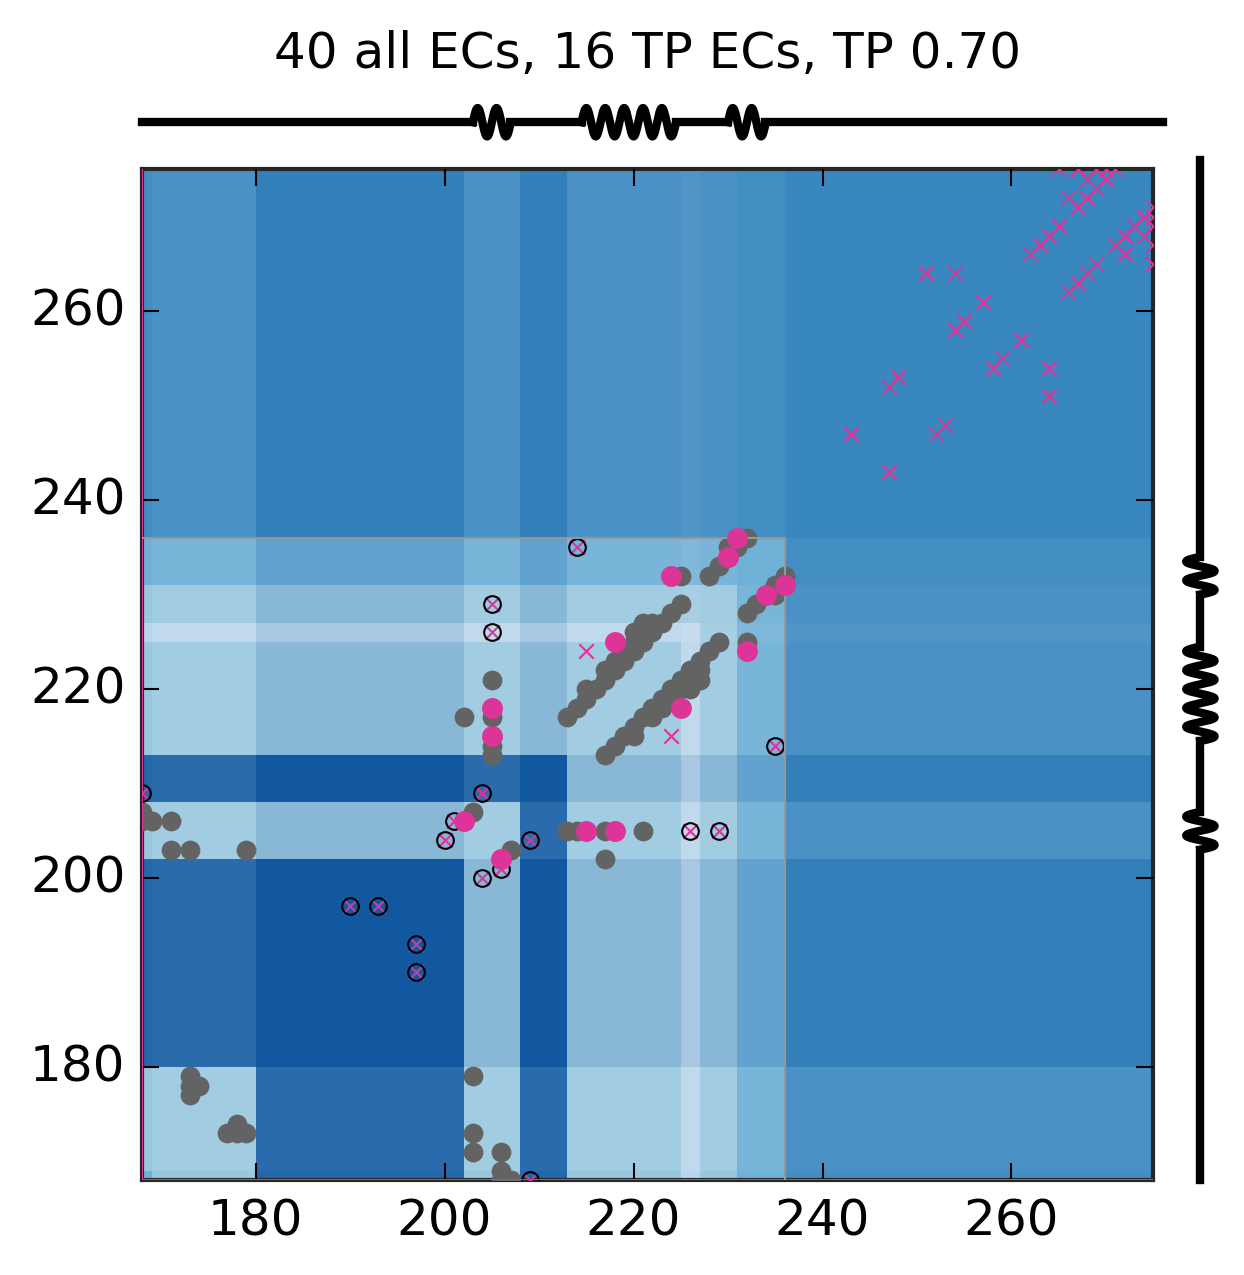
Predicted and experimental contacts
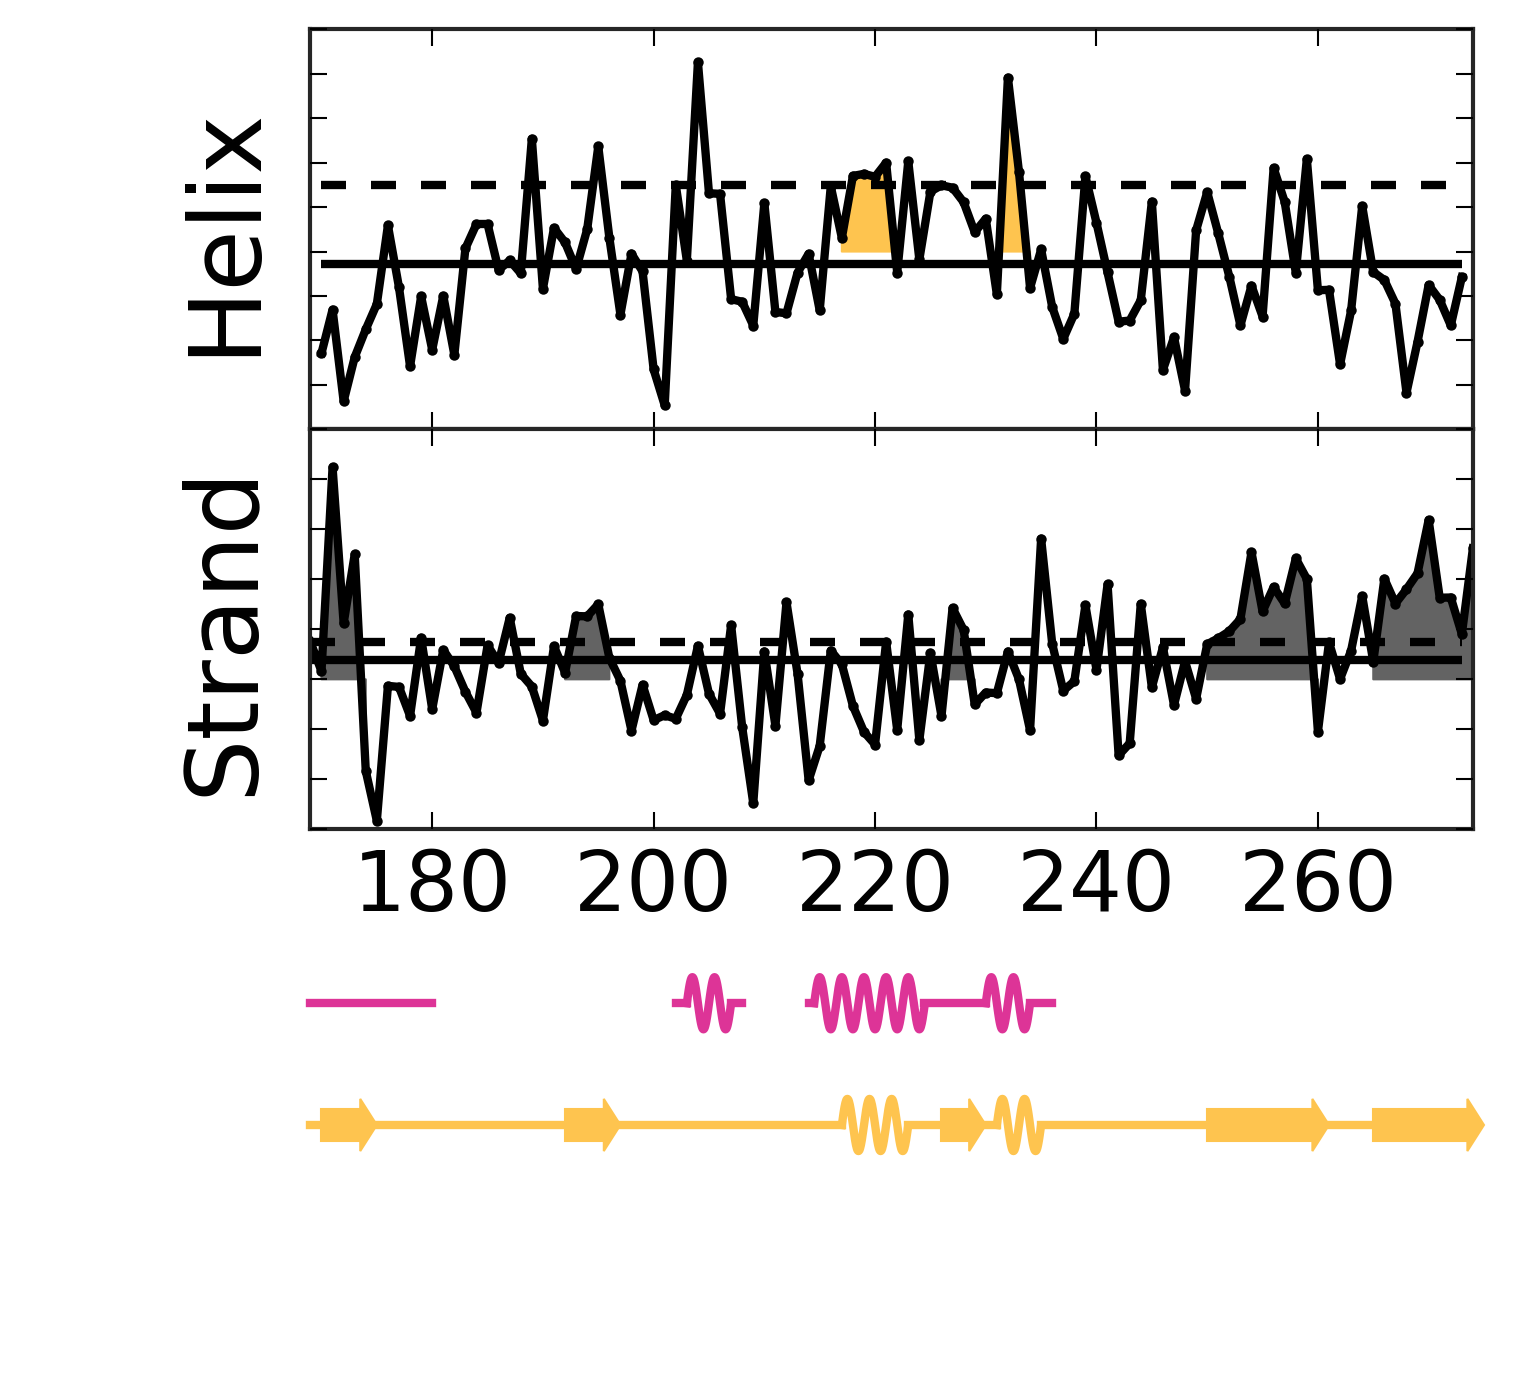
Secondary structure from ECs
EC score distribution and threshold
Top ECs
| Rank |
Residue 1 |
Amino acid 1 |
Residue 2 |
Amino acid 2 |
EC score |
| 1 |
268 |
D |
274 |
E |
0.48 |
| 2 |
262 |
D |
266 |
D |
0.45 |
| 3 |
268 |
D |
272 |
E |
0.41 |
| 4 |
269 |
E |
275 |
D |
0.40 |
| 5 |
205 |
W |
218 |
G |
0.37 |
| 6 |
267 |
E |
271 |
E |
0.35 |
| 7 |
271 |
E |
275 |
D |
0.35 |
| 8 |
248 |
D |
253 |
E |
0.35 |
| 9 |
190 |
A |
197 |
E |
0.34 |
| 10 |
269 |
E |
273 |
D |
0.34 |
| 11 |
243 |
G |
247 |
E |
0.34 |
| 12 |
270 |
G |
275 |
D |
0.34 |
| 13 |
201 |
S |
206 |
F |
0.34 |
| 14 |
267 |
E |
275 |
D |
0.33 |
| 15 |
200 |
E |
204 |
T |
0.31 |
| 16 |
257 |
G |
261 |
I |
0.31 |
| 17 |
224 |
D |
232 |
Y |
0.31 |
| 18 |
263 |
E |
267 |
E |
0.31 |
| 19 |
202 |
F |
206 |
F |
0.30 |
| 20 |
270 |
G |
274 |
E |
0.30 |
| 21 |
205 |
W |
215 |
D |
0.30 |
| 22 |
231 |
Q |
236 |
P |
0.30 |
| 23 |
266 |
D |
272 |
E |
0.29 |
| 24 |
254 |
E |
258 |
L |
0.29 |
| 25 |
265 |
G |
269 |
E |
0.29 |
| 26 |
193 |
K |
197 |
E |
0.29 |
| 27 |
265 |
G |
275 |
D |
0.28 |
| 28 |
255 |
E |
259 |
E |
0.28 |
| 29 |
251 |
D |
264 |
E |
0.28 |
| 30 |
205 |
W |
226 |
W |
0.27 |
| 31 |
168 |
S |
209 |
H |
0.27 |
| 32 |
254 |
E |
264 |
E |
0.27 |
| 33 |
205 |
W |
229 |
P |
0.27 |
| 34 |
264 |
E |
268 |
D |
0.27 |
| 35 |
230 |
L |
234 |
L |
0.26 |
| 36 |
214 |
A |
235 |
V |
0.26 |
| 37 |
247 |
E |
252 |
D |
0.26 |
| 38 |
218 |
G |
225 |
I |
0.26 |
| 39 |
204 |
T |
209 |
H |
0.26 |
| 40 |
215 |
D |
224 |
D |
0.26 |
Alignment robustness analysis
First most common residue correlation
Second most common residue correlation